
Situation
Client Background
A first-time Amazon Private Label seller entered the Kitchen & Home / Household Essentials category with a new product, no sales history, fewer than 10 reviews at launch, and an unoptimized listing. eBusiness Services LLC was engaged from Day 1 to build the PPC strategy, optimize the listing, and grow the account from zero to a sustainable, profitable business on Amazon.
Operational Challenge
Launching a new ASIN with no reviews, no organic rank, and a weak listing into a competitive category is one of the hardest scenarios in Amazon selling. The client faced a compounded set of obstacles: zero sales velocity to signal relevance to Amazon's algorithm, a listing with thin copy and low-quality imagery that suppressed conversion rates, and a constrained budget that had to work efficiently from the start. A significant stock disruption in December 2025 and January 2026 interrupted early momentum, temporarily dropping monthly revenue to $614 and $682 respectively — a critical test of the strategy's resilience. The core objective was clear: build rank and reviews fast enough to reduce ad-dependency, while maintaining a path to 10–15% net profit margin.
What we did
Executed Strategy
Phase 1 (Months 1–2) focused on aggressive keyword rank-building using Sponsored Products auto and broad campaigns to surface converting search terms, with exact-match harvesting beginning in Week 3. Negative keyword lists were implemented from the outset — a discipline rarely applied to new launches but critical for controlling early spend. Sponsored Brands campaigns with custom headline creative launched in Month 2 to establish top-of-search brand visibility before organic rank was established. Video ads were deployed in Month 3 targeting competitor product pages and high-intent category keywords, leveraging the product's visual differentiation to drive conversion. After the December–January inventory disruption, the account was relaunched with a refined keyword set built from the first two months of real conversion data — eliminating spend waste and prioritising the 20 highest-converting exact-match terms. Listing copy, title, and imagery were overhauled in coordination with the PPC relaunch, significantly improving the session-to-order conversion rate. TACoS was monitored as the primary health metric throughout — ensuring PPC spend was building organic sales lift, not merely buying paid orders.
Result
Measurable Outcome
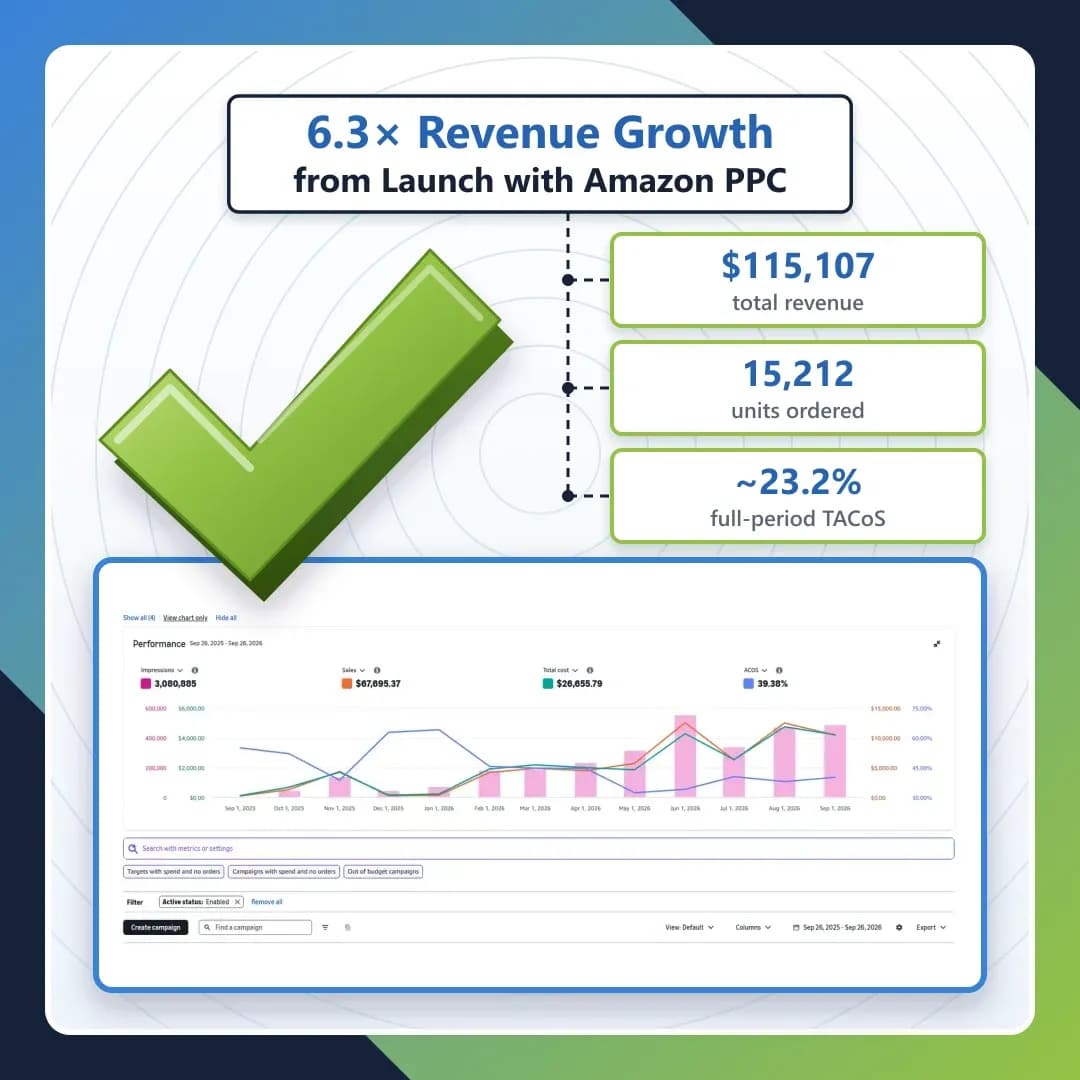
Over the 12-month period (Sep 2025 – Sep 2026), the account generated $115,106.97 in total revenue across 15,212 units ordered and 46,587 customer sessions. Monthly revenue grew from $3,660.22 at launch to a peak of $23,172.32 in August 2026 — a 6.3× increase. Total ad spend of $26,655.79 against $67,695.37 in ad-attributed sales produced a blended ACoS of 39.38%. TACoS for the full period measured approximately 23.2% — indicating that organic sales represented the majority of total revenue by the second half of the engagement. The June 2026 breakthrough saw monthly revenue cross $19,200 with 7,931 sessions — the direct result of organic rank reaching page 1 on core category keywords. The account achieved a positive profit margin and demonstrated the unit economics required to scale ad spend profitably into a 7-figure trajectory.
Month-by-Month Performance
Verified from Seller Central Business Reports
| Month | Revenue | Units | Sessions | Conv. Rate | Notes |
|---|---|---|---|---|---|
| Oct 2025 | $3,660.22 | 354 | 1,961 | 18.05% | Launch month — building velocity |
| Nov 2025 | $10,853.17 | 875 | 4,291 | 20.39% | Early breakthrough — 3× growth |
| Dec 2025 | $614.75 | 75 | 660 | 11.36% | Inventory disruption — stock out |
| Jan 2026 | $682.06 | 86 | 572 | 15.03% | Stock recovery phase |
| Feb 2026 | $6,629.32 | 553 | 2,604 | 21.24% | Relaunch — refined keyword set |
| Mar 2026 | $7,864.78 | 996 | 3,240 | 30.74% | Conv. rate peak — listing overhaul |
| Apr 2026 | $6,707.27 | 933 | 3,065 | 30.44% | Sustained high conversion |
| May 2026 | $7,586.34 | 1,075 | 3,380 | 31.81% | Organic rank building |
| Jun 2026 | $19,203.79 | 2,838 | 7,931 | 35.78% | Organic flywheel activated — 2.5× |
| Jul 2026 | $10,301.97 | 1,540 | 4,388 | 35.10% | Post-peak stabilisation |
| Aug 2026 | $23,172.32 | 3,435 | 8,305 | 41.36% | Peak month — $23K revenue |
| Sep 2026 | $17,830.98 | 2,452 | 6,190 | 39.61% | Strong Q4 entry |
| Total | $115,106.97 | 15,212 | 46,587 | 27.58% avg | 6.3× growth Oct→Aug |
Advertising Console Summary
Sep 26, 2025 – Sep 26, 2026
| Metric | Value | Context |
|---|---|---|
| Total Impressions | 3,080,885 | Broad reach across SP, SB & Video campaigns |
| Ad-Attributed Sales | $67,695.37 | 58.8% of total revenue driven via paid ads |
| Total Ad Spend | $26,655.79 | Efficient deployment across 3 ad types |
| Blended ACoS | 39.38% | Improving quarter-over-quarter as organic scaled |
| Total Revenue | $115,106.97 | Includes organic + paid sales |
| TACoS (calculated) | ~23.2% | Ad spend as % of total revenue — reflects organic growth |
| Units Ordered | 15,212 units | Average selling price $8.37 |
| Total Sessions | 46,587 | Avg. conv. rate 27.58% — strong product fit |
| Units Refunded | 416 (2.73%) | Well within healthy category range |
| Peak Month | $23,172 (Aug 26) | 8,305 sessions · 3,435 units · 41.36% conv. |
All data verified from Amazon Seller Central & Advertising Console (Sep 2025 – Sep 2026). Client identity kept confidential per mutual agreement.